Top ten countries by GDP according to PPP

Top ten countries worldwide in terms of GDP by purchasing power parity over the years, shown by animated plot
Author

Fazliddin Sultonov

Published

Oct, 2025

Datasource: World Bank

Load Data

Code
dataraw <- read.csv2("data/gdp_ppp.csv") # , sep = ";",encoding = "utf-8"
years <- paste(1990:2024) #, sep=",", collapse= ","
years <- unlist(strsplit(years, ","))
new_cnames <- c("country", "ccode",  years)
colnames(dataraw) <- new_cnames

data <- dataraw
rmarkdown::paged_table(head(data)) # show sample 10 rows

prepare data

pivot long

Code
fdec <- function(x) round(x/1000000000000, digits = 2) # trl to mlr
df <-
  data |> 
  mutate(across(!c(country, ccode), fdec)) |> 
  pivot_longer(
    cols = !c(country, ccode),
    names_to = "year",
    values_to = "gdp"
  ) |> 
  mutate(year = as.integer(year))

head(df)
#> # A tibble: 6 × 4
#>   country ccode  year   gdp
#>   <chr>   <chr> <int> <dbl>
#> 1 China   CHN    1990  1.12
#> 2 China   CHN    1991  1.27
#> 3 China   CHN    1992  1.49
#> 4 China   CHN    1993  1.73
#> 5 China   CHN    1994  2   
#> 6 China   CHN    1995  2.27

top 10 countries by each year

Code
df_top <-
  df |> 
  #select(-ccode) |> 
  group_by(year) |> 
  slice_max(order_by = gdp, n = 10) |> 
  arrange(year, desc(gdp)) |> 
  mutate(rank= 1:n()) |> 
  ungroup()

df_top |> 
  arrange(desc(year)) |> 
  head(n = 12)
#> # A tibble: 12 × 5
#>    country            ccode  year   gdp  rank
#>    <chr>              <chr> <int> <dbl> <int>
#>  1 China              CHN    2024 38.2      1
#>  2 United States      USA    2024 29.2      2
#>  3 India              IND    2024 16.2      3
#>  4 Russian Federation RUS    2024  6.92     4
#>  5 Japan              JPN    2024  6.41     5
#>  6 Germany            DEU    2024  6.04     6
#>  7 Brazil             BRA    2024  4.73     7
#>  8 Indonesia          IDN    2024  4.66     8
#>  9 France             FRA    2024  4.2      9
#> 10 United Kingdom     GBR    2024  4.2     10
#> 11 China              CHN    2023 35.5      1
#> 12 United States      USA    2023 27.7      2

df for plot

Code
# df for plot
df_plt <- 
  df_top |> 
  mutate(cflags = paste0("images/", ccode, ".png")) |>
  mutate(
    country = case_when(
      country == "United States" ~ "USA",
      country == "United Kingdom" ~ "UK",
      country == "Russian Federation" ~ "Russia",
      TRUE ~ country
    )
  )
#

plot

Code
df_plt |>  
  filter(year == 2024) |> 
  ggplot(aes(x = reorder(country, gdp), y = gdp)) +
    geom_col(fill = "steelblue", alpha = 0.6) +
    geom_image(aes(image = cflags, y = -2.3),  size = 0.13, by = "width") + 
    scale_y_continuous(labels = function(y) ifelse(y == 0, paste0(y), paste0(y, "k"))) +
    geom_text(aes(label = gdp), hjust = -0.1, color = "darkgrey", fontface = "bold") +
    labs(
      x = NULL, y = "GDP, PPP in Mlrd. in USD (k = 1000)", 
      title = "**Top ten countries by GDP, PPP in 2024**",
      caption = social_caption) +
    #geom_label(aes(label = paste("Year:",year)), x = 2, y = 30, size = 10, fill = "white", col = "gray") +
    coord_flip() +
    theme_minimal() +
    theme(
      plot.title = ggtext::element_markdown(size=14, color="steelblue4", hjust = 0.5),
      plot.caption = ggtext::element_markdown(size=14, hjust = 0.5),
      plot.background = element_rect(fill = "ghostwhite"),
      panel.grid.major.y = element_blank(),
      panel.grid.minor.y = element_blank(),
      panel.grid.minor.x = element_blank(),
      axis.line.x =  element_line(colour = "gray")
    )

animated plot over the years

Code
plt <-
  df_plt |>  
  ggplot(aes(x = reorder(rank, gdp), y = gdp)) +
    geom_col(fill = "steelblue", alpha = 0.6) +
    geom_image(aes(image = cflags, y = -2.3),  size = 0.13, by = "width") + 
    scale_y_continuous(labels = function(y) ifelse(y == 0, paste0(y), paste0(y, "k"))) +
    geom_text(aes(label = gdp), hjust = -0.1, color = "darkgrey", fontface = "bold") +
    geom_label(aes(label = paste("Year:",year)), x = 2, y = 30, size = 8, fill = "white", col = "gray") +
    labs(
      x = NULL, y = "GDP, PPP in Mlrd. in USD (k = 1000)", 
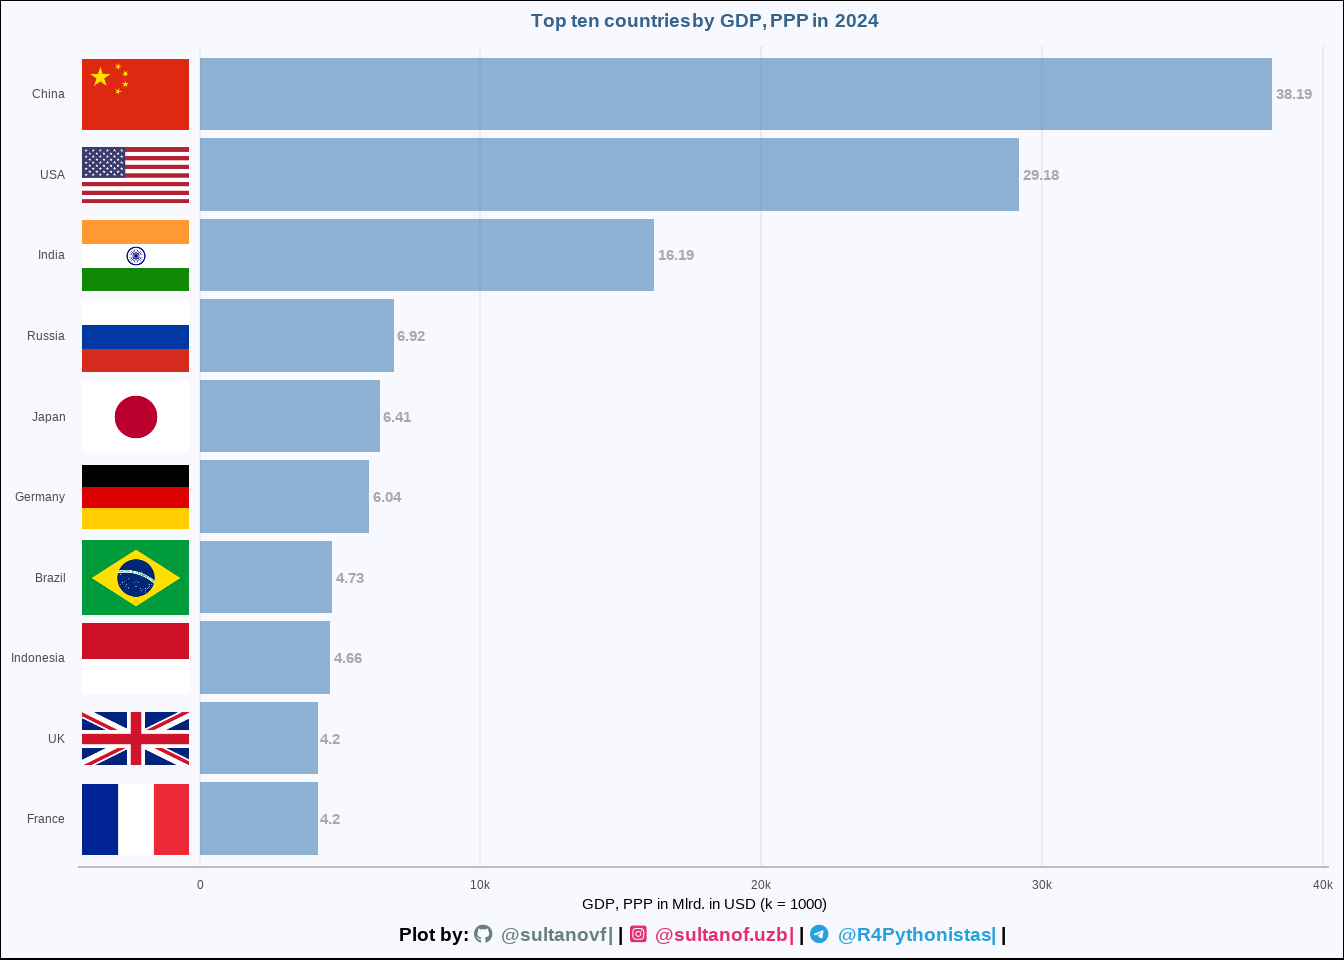
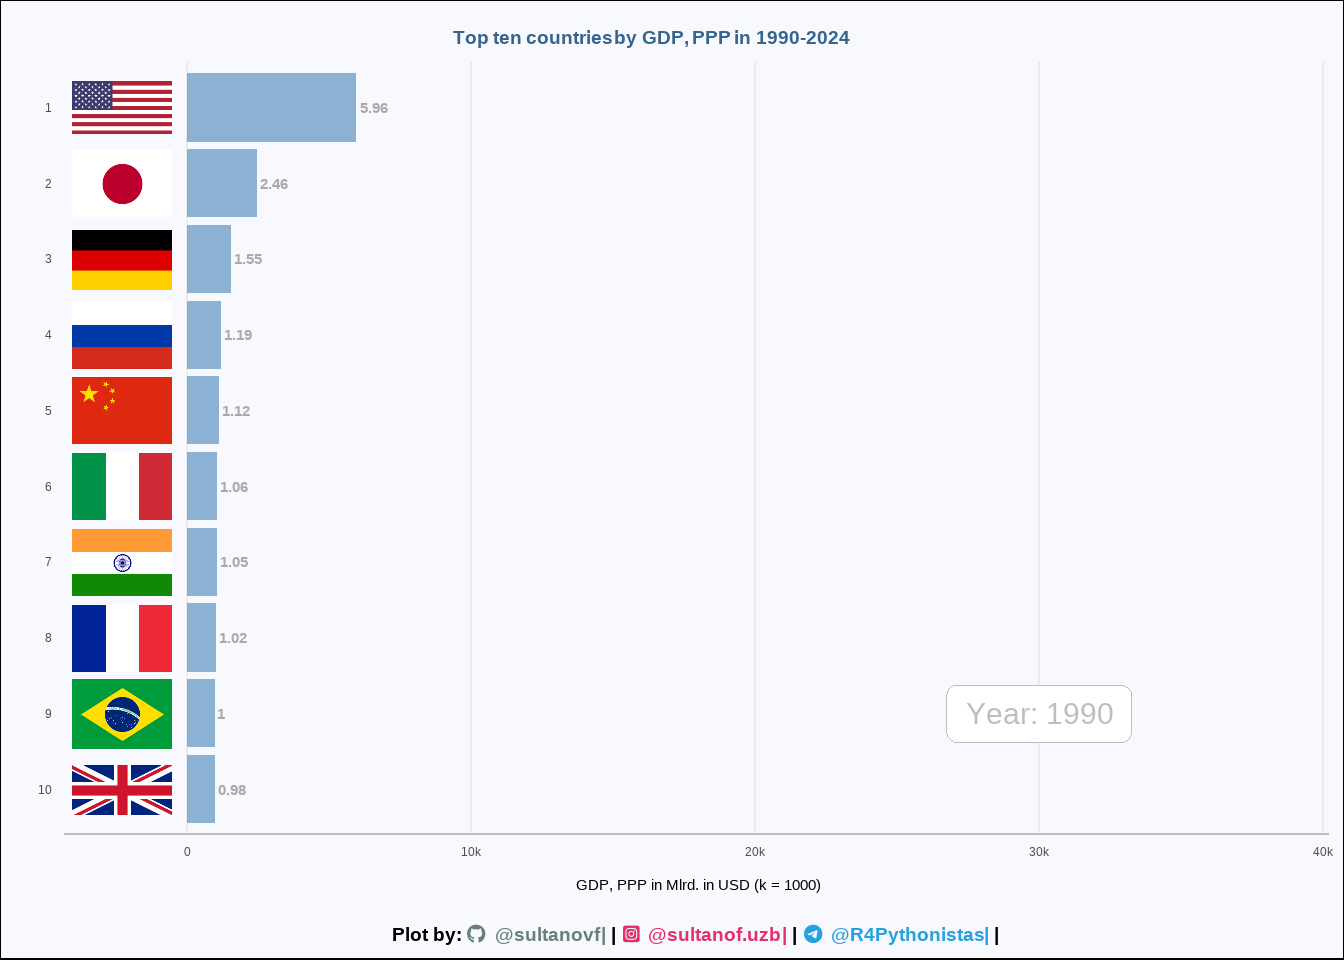
      title = "**Top ten countries by GDP, PPP in 1990-2024**",
      caption = social_caption) +
    coord_flip() +
    theme_minimal() +
    theme(
      plot.title = element_markdown(size=14, color="steelblue4", hjust = 0.5),
      plot.caption = ggtext::element_markdown(size=14, hjust = 0.5),
      plot.background = element_rect(fill = "ghostwhite"),
      panel.grid.major.y = element_blank(),
      panel.grid.minor.y = element_blank(),
      panel.grid.minor.x = element_blank(),
      axis.line.x =  element_line(colour = "gray")
    )
 plt_anim <-
  plt +
  transition_states(year, wrap = FALSE, transition_length = 1, state_length = 1) +
  enter_fade() + 
  exit_fade()

anim <- animate(
  plt_anim,
  duration = 45,
  start_pause =5,
  end_pause = 5,
  renderer = gifski_renderer()
)
anim